Summary Data - Counting and Grouping
Scenario
A car showroom needs a database to help track stock. Here is a sample of a proposed design.
Wouldn't it be great if we could analyse a table to the number of records that are red cars or count how many of each color of car is in the database eg:
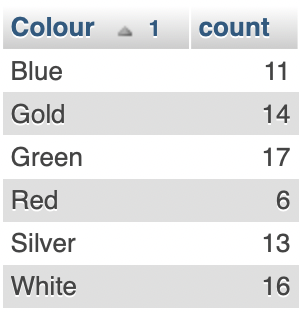
We can see here that each record is grouped by color and a count of each color is included in the query result.
Task 1 - Import
Download the csv file about peripheral devices. Save it in a project folder.
Import the data into a XAMPP database table.
Remember to ask yourself a couple of questions:
- Does the first row contain field names?
- Is there a field which makes every record unique? If so, set it to be the Primary Key field. If not, add a new field called id which auto-increments.
Challenge 1 - Summary Data
Design-Test-Redesign the following queries. Paste your solutions into your worksheet where indicated.
Hint! Your queries should produce the same number of records as indicated.
| this query groups by model and shows a count of all models with the word Micro in it. | 70 records |
| this query groups by color and shows a count of all white, silver or gold Micro models priced between 8000 and 10000 inclusive. | gold 3, silver 3, white 4 |
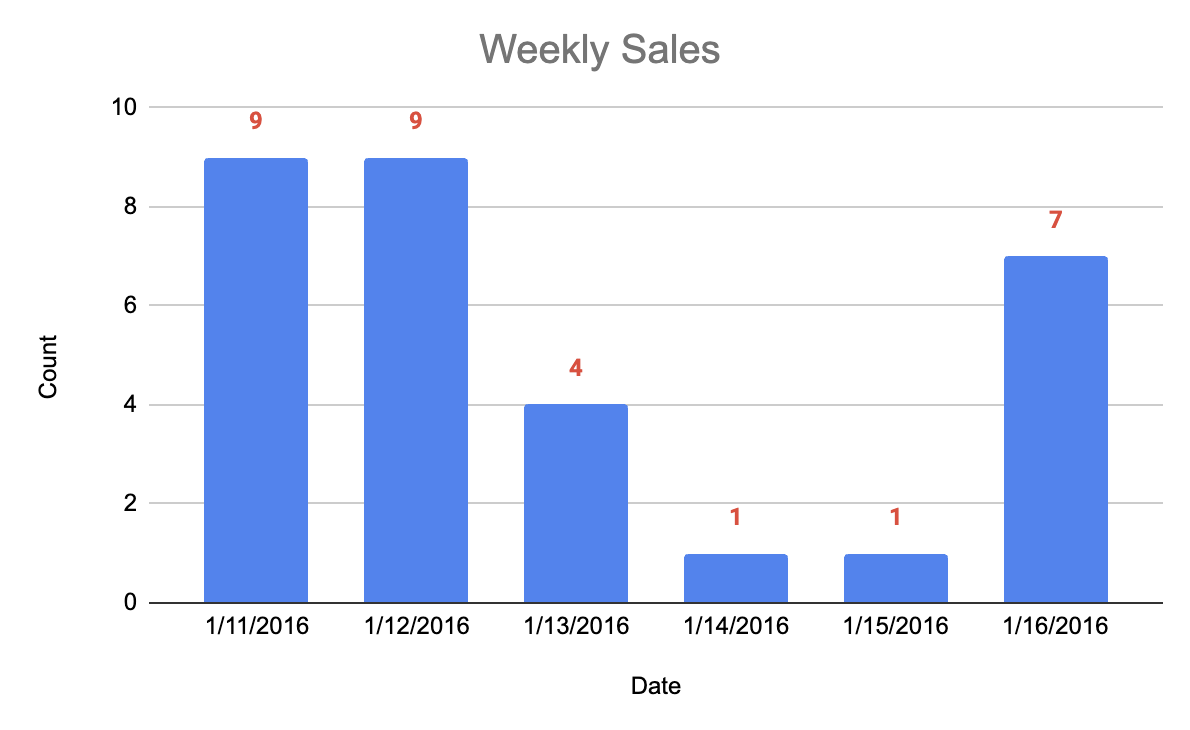
| this query groups by date and shows a count of all cars sold between January 11 and January 15 inclusive, sorted in ascending order of date. | Jan 11 - 9; Jan 12 - 9; Jan 13 - 4; Jan 14 - 1; Jan 15 - 1; |
Challenge 2 - A chart
Use the data from the third query to create a bar chart showing the number of sales for the 5 dates.
it should look like the following. Note the differences:
- Title, centered and orange
- Y Axis label: Sales Count
- X Axis label: Sales Date
- Orange data labels outside each bar
- Orange bars
Food For Thought
Queries are very smart. They can be used to filter data. They can also be used to group and count and sum and average and... actually, queries can do load of things! Delete records, insert records, create tables, compare records...


Homework
essential vocabulary
database sigma querycriteriaimport evidence table integer screenshot record text ascending field double descending data type Yes/No