Graphs
An international javelin competition uses spreadsheet software to store and process throw data (in meters) for each athlete in the competition. Here is a sample of the results.
| A | B | C | D | E | F | G | |
|---|---|---|---|---|---|---|---|
| 1 | Name | Country | Throw #1 | Throw #2 | Throw #3 | Number of throws | Average |
| 2 | Nigel George | NZE | 77.02 | 85.02 | 73.29 | 3 | |
| 2 | Ryan Ramsey | USA | 70.67 | 77.67 | 2 | ||
| 3 | Alicia Crooks | USA | 55.97 | 63.1 | 81.17 | 3 | |
| 4 | Ryan Ramsey | USA | 70.67 | 77.67 | 2 | ||
| 5 | Trudy Thompson | ENG | 49.81 | 48.17 | 69.44 | 3 | |
| 6 | Aiesha Mcmeo | RSA | 81.22 | 68.4 | 71.18 | 3 | |
| 7 | Sunil Rampaul | ITA | 83.04 | 90.2 | 2 | ||
| 8 | Brendan Mullins | IRE | 49.88 | 53.66 | 42.85 | 3 |
The distance thrown for each throw is stored and the average is calculated. The number of throws is also counted automatically by the software.
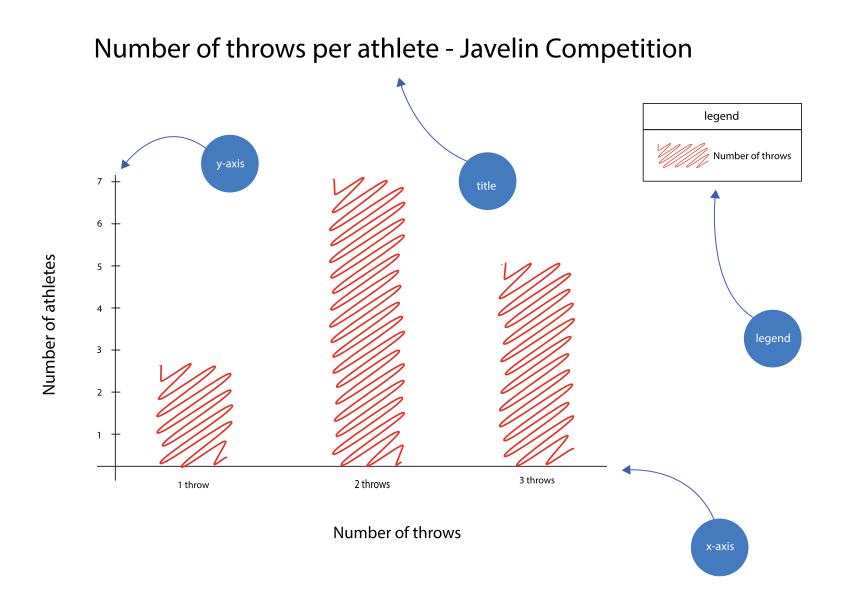
The organisers want to display a graph showing how many athletes acieved 1 throw, how many athletes achieved 2 throws and how many athletes achieved 3 throws.
Here is a sketch of the graph required:
In most spreadsheet software applications, data is entered and/or calculated and then the appropriate data is selected with the mouse and a chart is inserted.
Task
If you are using Google Sheets, use this sheet.
If you require a csv file to get started, download this one.
Follow these instructions to develop the spreadsheet model:
Post a link to your video and images on this padlet. Include the interesting facts
Submit your final spreadsheet file as instructed. BEWARE of saving your work in a CSV file - all of your formatting, functions and chart will be lost!!
Food For Thought
Charts allow us to quickly visualize data and spot trends or other useful information. For example, in today's exercise we can quickly see that all athletes had at least one throw.


Homework
Tags
spreadsheet data csv model merge insert row format currency column range decimal places cell reference